The following video tutorial demonstrates the functionality of ruFilter() and ruProcess(), two functions that filter and normalize the data, as well as run a Principal Component Analysis (PCA).
Follow along with the code below.
Filtering by Gene Expression with ruFilter()
#These steps happen automatically within the Shiny App#doing them manually simply gives you more autonomy over the individual steps### FILTERING#here we filter for excitatory cells which are Slc17a7+myobj <-ruFilter(myobj, filter.by ='Slc17a7', threshold =0.1, exclude =c('RSC', 'LEC'))
[1] "Running gene exclusions..."
[1] "Filtering data by Slc17a7 at threshold of 0.1..."
[1] "Updating metadata..."
This step will populate the @filteredData slot with the data frame filtered to only include cells with an Slc17a7 value > 0.1
It will also exclude the filtering gene and any others that you choose to exclude. Here we have excluded the viral injection data as they are not indicitive of gene expression.
This step will also place any excluded variables into the @metaData slot and create a new $fil column that tells the user whether the cell is filtered out or not.
This function will normalize the data (option of either “log” or “PAC”) as well as run a PCA.
myobj <-ruProcess(myobj)
[1] "Normalizing the data..."
[1] "Running PCA..."
[1] "Updating metadata..."
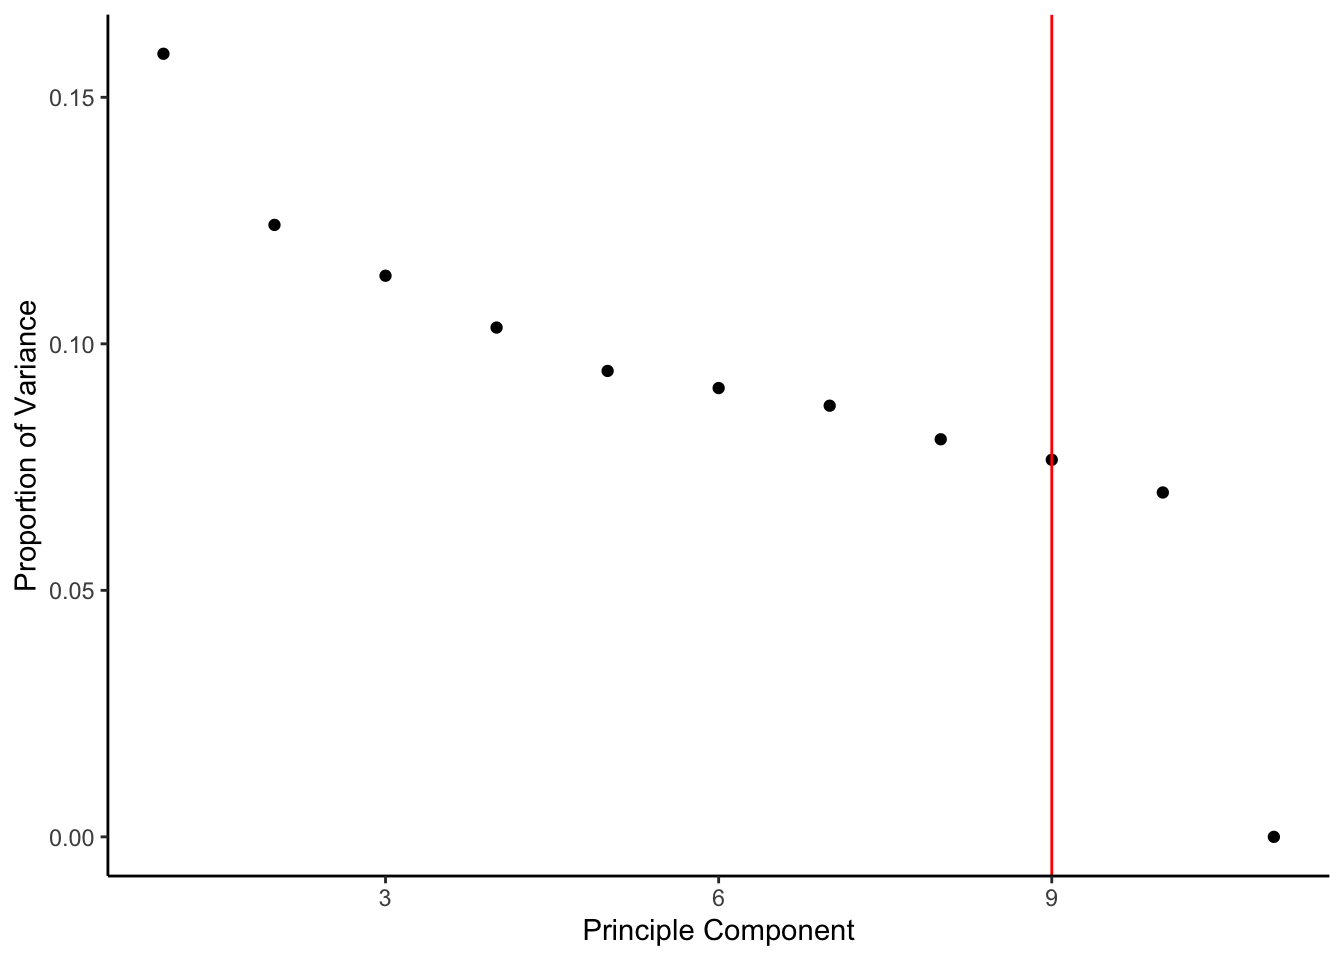
From here the @filteredData slot will be updated with the normalized data. The attributes will also be updated to include the PCA itself (@attributes$pca) and the number of PC’s contributing ~95% variance to the data (@attributes$npc).
We can visualize this using plotVar(). The red line indicates the number of PCs that will automatically be used if the user doesn’t override this choice.