#populate attributes with UMAP for plotting
#you can use the optional argument npc to  select more or less PCs
myobj <- ruUMAP(myobj)
[1] "Altering UMAP configurations..."
[1] "Running UMAP..."
[1] "Saving custom configuration..."The following video tutorial demonstrates the functionality of ruUMAP() and ruCluster(), two functions that dimensionally reduce and hierarchically (method = “ward.D2”) cluster the data.
Note that UMAPs have built-in stochasticity, meaning they will look different between computers
Follow along with the code below.
ruUMAP()Once run, you can access the UMAP coordinates in the attributes (@attributes$umap).
#populate attributes with UMAP for plotting
#you can use the optional argument npc to select more or less PCs
myobj <- ruUMAP(myobj)[1] "Altering UMAP configurations..."
[1] "Running UMAP..."
[1] "Saving custom configuration..."ruCluster()This function clusters the data using ward D2 hierarchical clustering. Select a number of clusters you beleive the data might have. Once run, a new @metaData column will be generated.
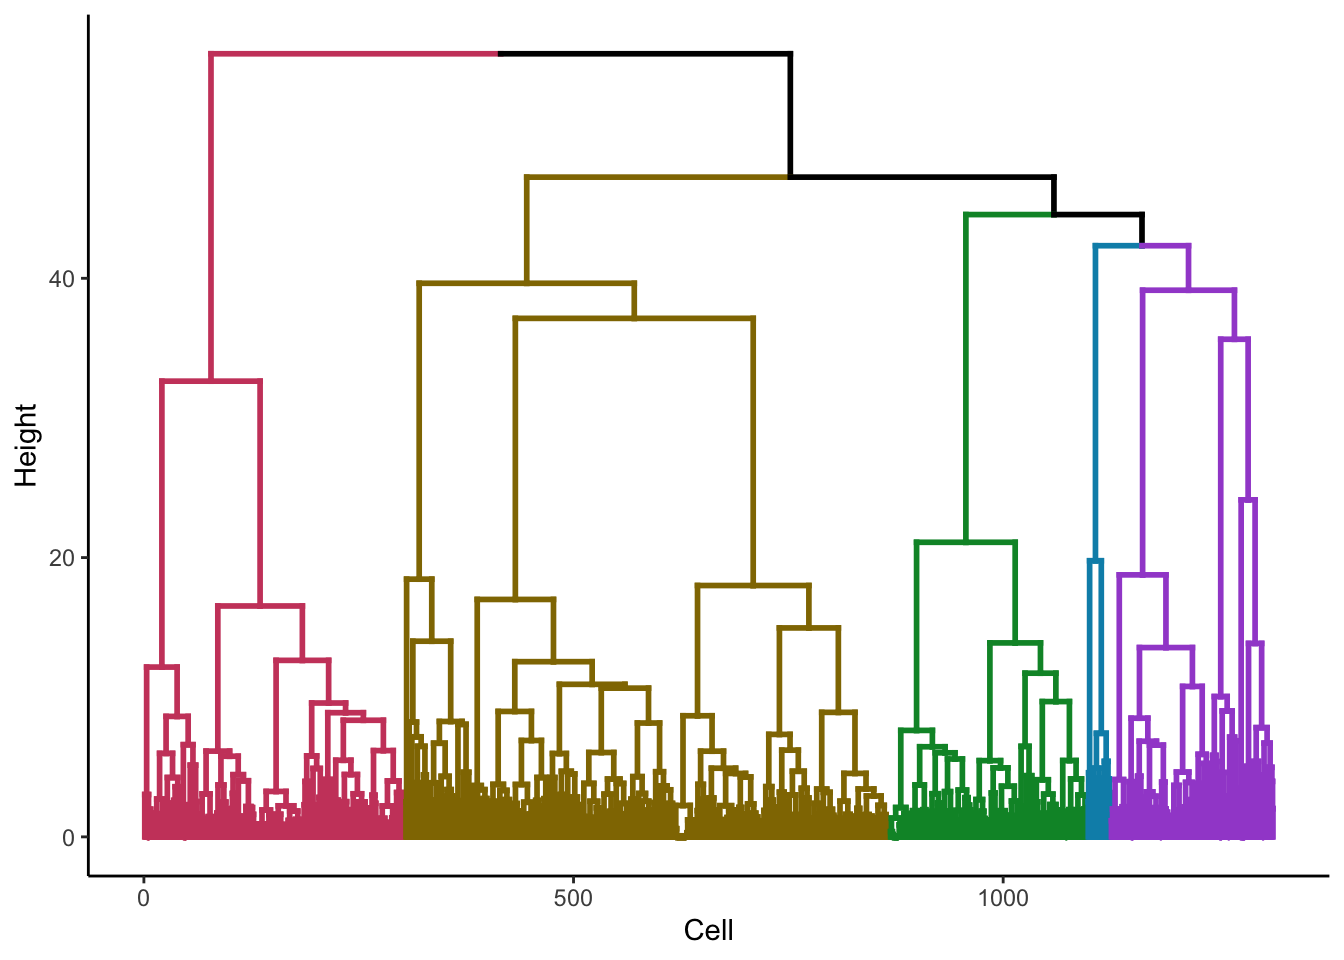
To refine the number of clusters, check the dendrogram with plotDendro() and re-run ruCluster() as many times as you see fit.
#populate metaData with cluster column
myobj <- ruCluster(myobj, k = 5)
[1] "Clustering..."#check the dendrogram to see if you agree with number of clusters
plotDendro(myobj)[1] "Creating dendrogram..."
[1] "Plotting..."
[1] "Please wait, this may take a while..."